«If the platform can't read the responses, it can't give you analytics» is the most common objection to encrypted form tools, and it is wrong in an interesting way. It confuses two different things: knowing what people answered, and knowing how the form performed. The second is almost entirely a counting problem, and counting does not require reading.
The short version
Nearly every metric that changes a decision is an aggregate: how many people opened the form, how many finished, which question loses them, how long it takes, what device they were on. None of those need a visitor identity, a cookie, or the content of anybody's answer — they need counters incremented when a page is viewed and when a response arrives. What you give up is segmentation: you cannot ask «do mobile users skip question 7 more often», because that cross-tabulation is exactly the join that starts re-identifying people in a small response set. What you gain is a form page with no third-party requests and no consent dialog in front of the first question, which measurably helps the number you actually care about.
The Metrics That Actually Change What You Do
Most form dashboards show a lot and inform little. These are the ones worth acting on, and none of them requires tracking:
| Metric | What it tells you | The action it triggers |
|---|---|---|
| Views → submissions (conversion) | Whether the form is worth the traffic you send it | Below ~20% for a short form usually means the form is too long, too early, or asking for something people won't give |
| Per-question answer rate | Which question people skip or abandon on | The single most useful number on the page: fix, soften, or delete that question |
| Completion time, with percentiles | The median and the tail. An average hides the people who struggled | If p75 is triple the median, part of your audience is fighting a specific field |
| Estimated versus actual duration | Whether the form takes as long as you think it does | «Estimated two minutes, actual six» is the fastest way to justify cutting fields |
| Device split | Whether people are filling this in on a phone | A twelve-field form with a date picker is a different product on mobile — test it there |
| Time of day and weekday | When your audience is actually available | When to send the reminder; also whether an announcement landed |
| Unread backlog and response time | How your team is handling what arrives | The metric nobody measures, and the one respondents feel |
Notice what is not on that list: individual journeys, heatmaps of mouse movement, session replays, cohort retention. Those are website-optimisation instruments imported into a context where they mostly produce screenshots for slide decks — and on a form, they are the ones that carry the real privacy cost.
Two Ways to Get Those Numbers
| Client-side tracking | Receive-time counters | |
|---|---|---|
| How it works | A script on the form page records events against a visitor identifier and sends them to a collector | The server increments counters when the page is served and when a response arrives |
| What is stored | A per-visitor session record with device data, timestamps and an event stream | Integers. No row per person, no identifier to resolve |
| Consent posture | Cookie/tracker rules apply; a banner is usually required for EU respondents | Nothing is stored on the device, so the question mostly does not arise |
| Segmentation | Rich — any dimension against any other | Deliberately limited: each dimension is counted separately, never crossed |
| Abandonment detail | Can see exactly where someone stopped, including people who never submitted | Sees skipped questions among people who did submit, plus the view-to-submit gap in aggregate |
| What it costs you | A tracker on a page where people type sensitive things, and a disclosure to document | You will occasionally want a cross-tab you cannot have |
The honest gap, stated plainly
Receive-time counters cannot tell you where someone abandoned if they never submitted anything — nothing arrived to count. You get the aggregate view-to-submit gap, and you get skip rates among completers, and from those two you can usually infer the problem question. If pinpointing pre-abandonment behaviour per visitor is genuinely essential to your work, you want a tracked form and the consent apparatus that comes with it. For most forms, it is not.
Why Not Cross-Tabulating Is the Feature
It looks like a limitation, and it is the single most deliberate decision in this design. «Mobile users who submitted on Tuesday and skipped the salary question» is not an insight, it is a filter — and when your form has 34 responses, that filter returns two people whom the team can name.
This is the same re-identification arithmetic that decides whether an anonymous survey is actually anonymous, covered in how many responses before anonymity holds. The safeguard is architectural rather than procedural: if the underlying counters were never crossed, no report can accidentally cross them, no admin can be tempted to, and no export can leak the combination. A promise nobody can break is worth more than a policy everybody must remember.
Two other properties follow from counting at receive time, and they are worth understanding because they show up in the interface:
- Counters do not go down. Delete a submission and the per-question counters keep it, because the per-person data needed to subtract it was never stored. That is why those figures read «of all responses received» rather than «of your current inbox» — an honest label for a genuine property, not a bug.
- There is no backfill. Metrics that were never counted cannot be reconstructed later; older responses simply show gaps. Any product that retroactively produces perfect historical analytics kept something per person to compute it from.
The Conversion Argument Nobody Makes
There is a commercial case here that has nothing to do with compliance. A form page that loads no third-party analytics, no tag manager, no external fonts and no hosted CAPTCHA needs no consent dialog. So the first thing a respondent sees is question one, rather than a modal asking them to make a decision about cookies before they have decided to fill anything in at all.
Every element between the click and the first question costs completions. A consent banner is the largest such element, it appears at the moment of highest hesitation, and — on a form asking for health details, a complaint or a salary figure — it also broadcasts «we are measuring you» at precisely the wrong instant. Removing trackers from a form page is one of the few privacy decisions that improves the metric it is measured against.
The legal frame in Switzerland is Art. 45c lit. b FMG — inform and offer refusal, rather than the EU's prior-consent model — with the FDPIC's guideline on cookies and similar technologies (v1.1, 6 October 2025) expecting the refusal option to be visible and exercisable in a few clicks. If your respondents are in the EU, the stricter consent standard applies to them. The cheapest way to satisfy every version of the rule is to have nothing on the page that triggers it. The full inventory of what a form page can leak is in what your form silently records.
How Schweizerform Measures Forms It Cannot Read
Concretely, because this is the part people assume is impossible:
- The public form page mounts no analytics and no beacon. Not a configurable option — the analytics provider simply is not part of that route. Nothing measures the respondent.
- Nothing in the analytics path decrypts anything. Every figure is either a counter incremented server-side at view or submit time, or derived from database columns that were never encrypted because they are not content.
- Per day, per form: views, QR-scan views, and submissions split by device class. Flat per-day counters, each dimension counted independently and never crossed with another.
- Per question: how many people saw it and how many answered it. At submit the client reports which question ids it answered, the server bumps the counters against the published question set — so a forged id cannot inflate anything — and then discards the report. No per-person, per-question record exists at any point.
- Per submission: three coarse integers — time from opening to submitting, how many questions were answered, how many existed — plus which of the four languages the form was displayed in. That is the entire per-person analytics footprint, and it is bounded, nullable and identity-free.
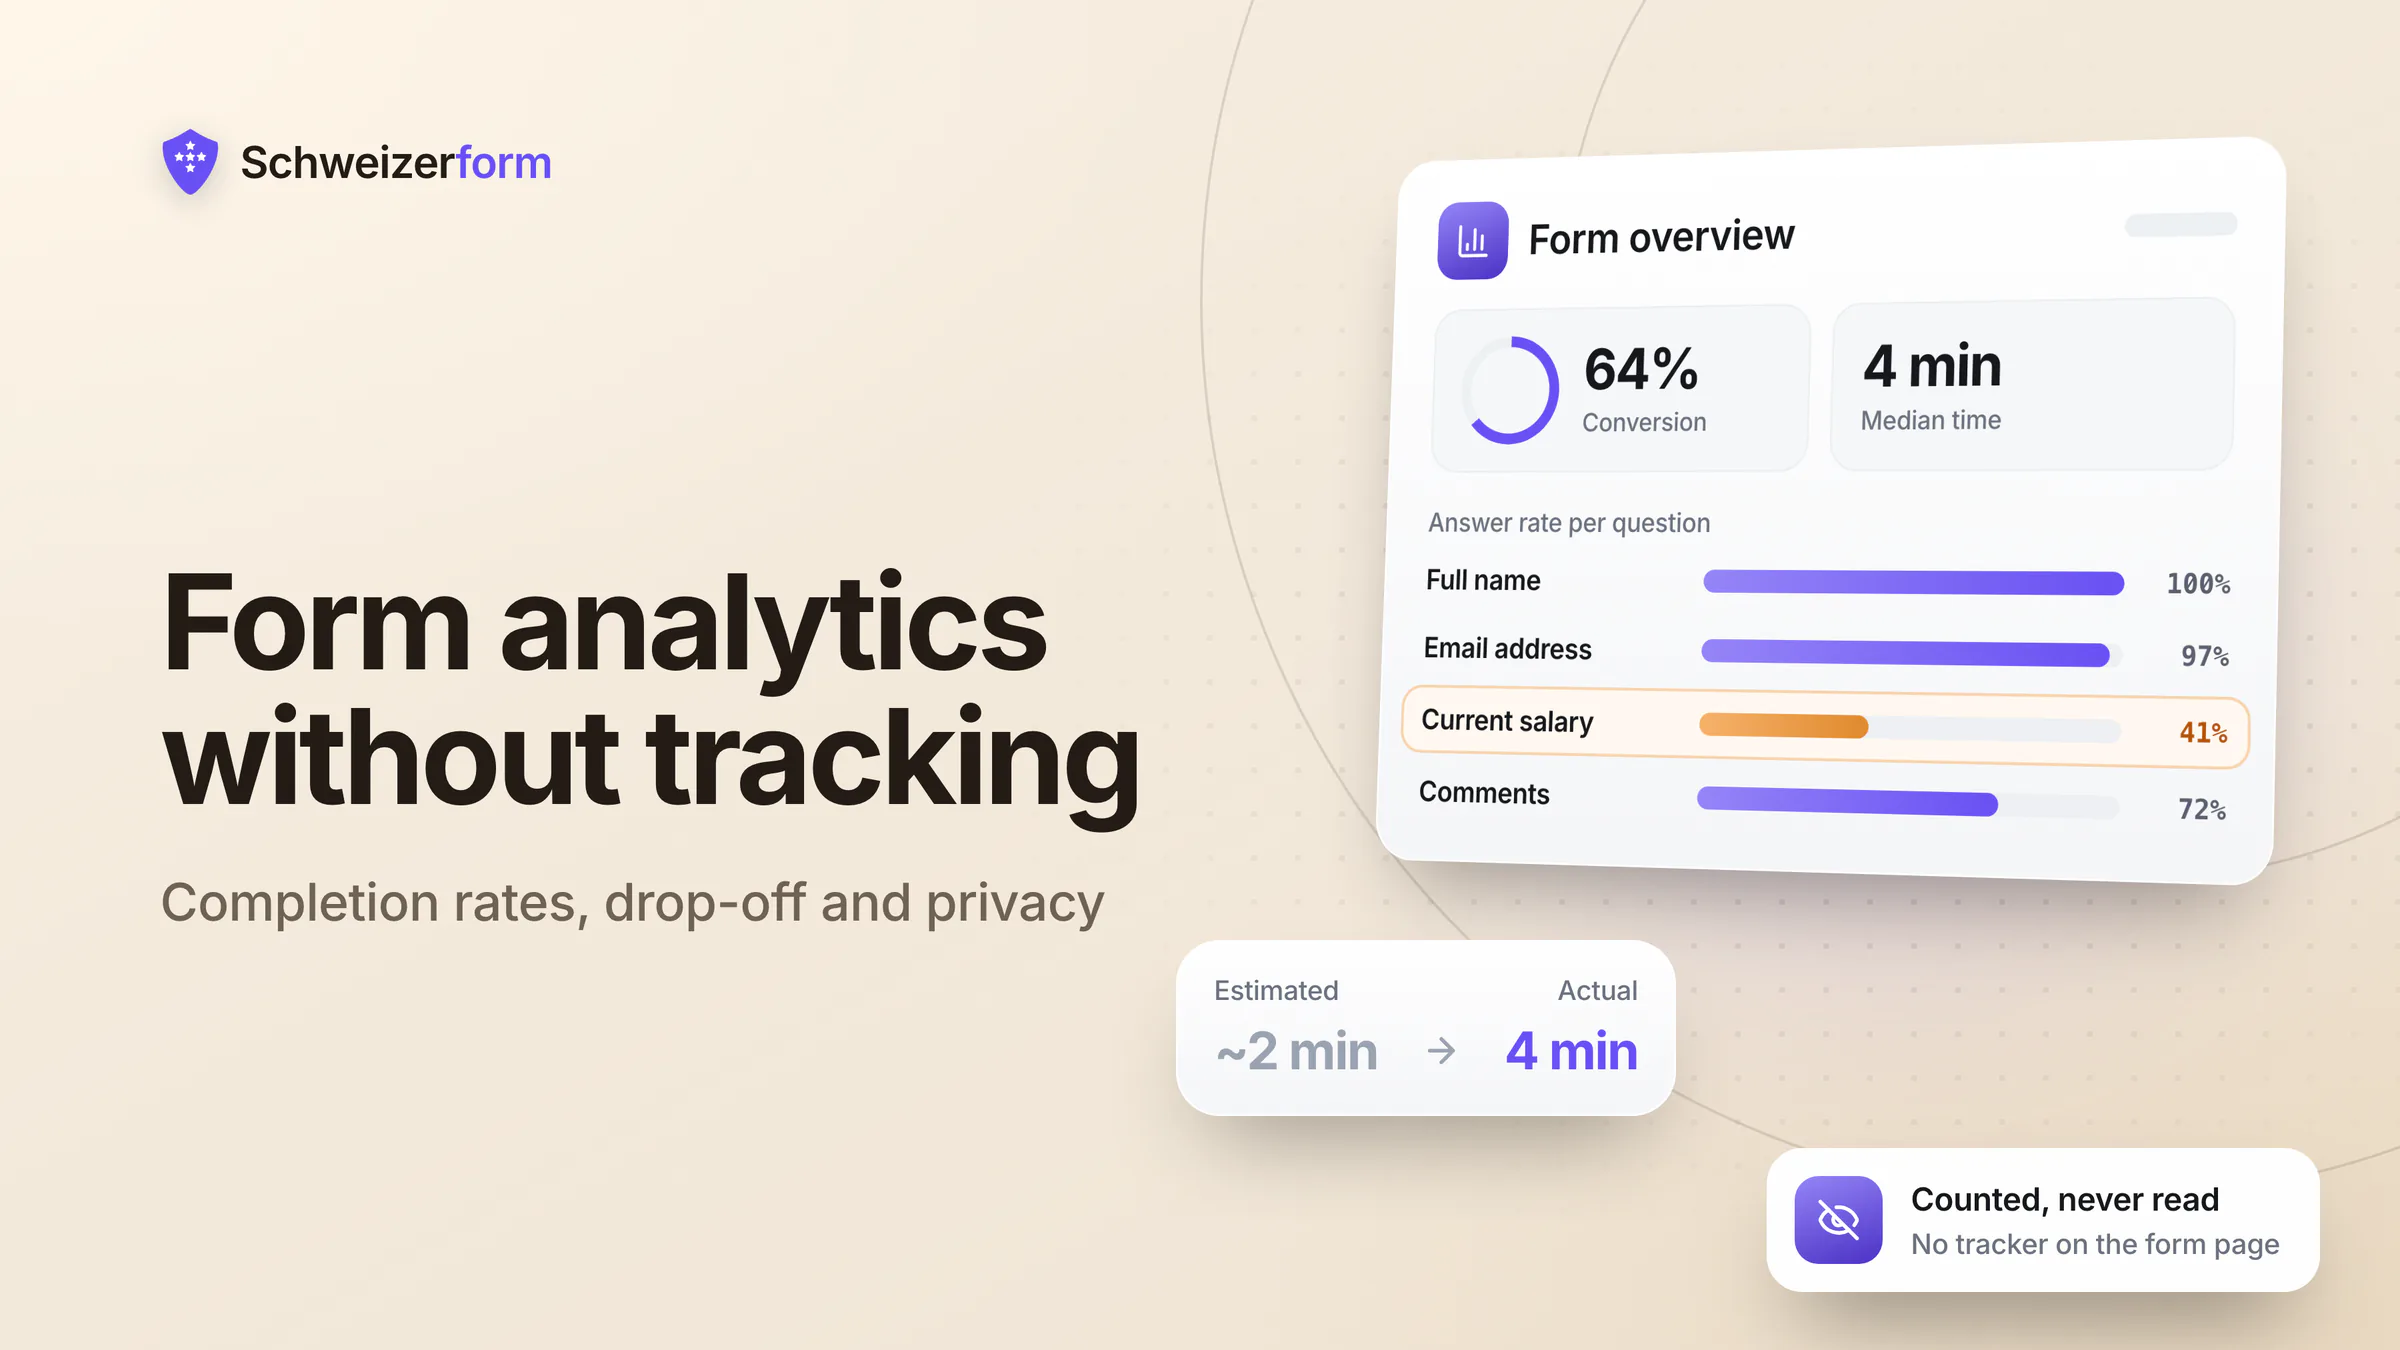
- Derived, not collected: a per-question-type time estimate compared against your measured average («estimated ~2 min, actual 4 min»), and a small rule-based suggestion engine — deterministic, at most two hints, no AI, and no access to content.
What that produces in the interface is the useful half of a normal analytics dashboard: conversion, completion-time percentiles and buckets, per-question answer rates, a weekday-and-hour heatmap, device and channel split, period-over-period deltas, and inbox operations. What it cannot produce is a list of visitors, a session replay, or any cross-tab — and that is the trade we made on purpose.
Reading Your Form's Numbers Without Fooling Yourself
- 1
Start with conversion, not volume
Submissions alone tell you about your traffic. Views-to-submissions tells you about your form. Only the second is something you can fix this week.
- 2
Find the question with the worst answer rate
Then ask whether it is required, whether it is phrased as an accusation, and whether you actually use the answer. Deleting one field usually beats redesigning a page.
- 3
Read the median, then the p75
The median tells you the typical experience; the gap to p75 tells you how big the struggling group is. A wide gap is almost always one specific field.
- 4
Compare estimated with actual duration
If the form takes three times as long as its structure predicts, something is confusing rather than merely long — that is a wording problem, not a length problem.
- 5
Open your own form on a phone
If the device split says mobile and you have only ever tested on a laptop, the numbers have already told you where the drop-off comes from.
- 6
Treat the unread backlog as a metric
Response time is the part of the experience the respondent actually perceives. It also predicts whether people fill in your next form.
- 7
Do not chase segments you cannot have
If you find yourself wanting a cross-tab on 40 responses, the honest answer is that the sample cannot support the conclusion anyway. Ask a better question of the whole set instead.
Counting is not reading. Almost everything worth knowing about a form is a number of people, not a list of them.
Bottom Line
Encryption does not cost you form analytics. It costs you surveillance analytics — per-visitor journeys, replays and arbitrary segmentation — and for most forms that is a trade in your favour, because the metrics that change decisions are aggregates and aggregates can be counted without identifying anyone.
It also removes an argument you would otherwise have to have. No tracker on the form page means no banner, no consent record for the analytics layer, no disclosure of your respondents' IP addresses to a measurement vendor, and nothing to explain when somebody asks what happens while they are typing. The dashboard gets slightly narrower and the conversation gets very short.
Schweizerform gives form owners conversion, per-question answer rates, completion-time percentiles, temporal patterns and device split — computed from receive-time counters, with no tracker on the form page and no decryption anywhere in the path. Encrypted submissions are stored in Switzerland. See features for what the overview page shows, and how to create a secure online form for the design side. For choosing a tool on this basis, see privacy-compliant survey tools compared; for the case where the numbers carry the most weight, employee survey forms.
Disclaimer: This article is general information and marketing content, not legal advice. References to Art. 45c FMG, the FDPIC guideline on cookies and similar technologies (v1.1, 6 October 2025), Art. 6 nFADP and the EU ePrivacy consent standard are simplified summaries of a position checked in July 2026. Statements about Schweizerform describe the product's documented behaviour as of that date and may change; the security page governs. Benchmarks such as conversion percentages are rules of thumb, not research findings — measure your own baseline before drawing conclusions.